News & Blog

🔬 Transform your computational chemistry!


Visualizing Molecular Dynamics: a scientific expedition into the world of atoms

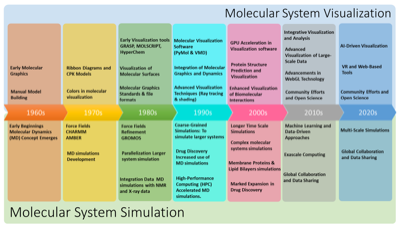
DecorativeRecently, I had the opportunity to contribute to two review articles on the visualization of molecular dynamics simulations. The first one deals with this topic in depth, while the second article takes a more targeted approach and focuses on membrane systems in a concise perspective. The first review article addresses challenges and opportunities in visualizing complex MD simulations. It emphasizes the need for novel visual representations tailored to the dynamics and intricacies of large biomolecular systems. In our work, we present a classification scheme based on a visual abstraction formalism that serves as a guiding framework and identifies potential areas for future progress. In the second manuscript, we address the current challenge of visualizing the complex dynamics of membrane systems. We provide a historical overview of the development of visualization techniques and trace their evolution from simple line representations in the 1980s to sophisticated graphics and virtual reality applications today.

More detailed summaries are below. If you want to directly access the manuscripts, they are here:

From complex data to clear insights: visualizing molecular dynamics trajectories


This article briefly reviews the history of molecular visualization and simulation and outlines the advances in computational power and techniques that have enabled the study of increasingly complex biomolecular systems. We then introduce the formalism of visual abstraction, which we have adapted to the context of MD simulations by proposing four axes of abstraction: Scale, Time, Molecule and Image.

We discuss different approaches and techniques along these axes, including multiscale visualization, temporal aggregation, molecule class-dependent visualization, and representations specifically developed for MD visualization. They highlight the strengths and limitations of existing methods and emphasize the need for new visual metaphors that can effectively capture the dynamics and complexity of modern MD simulations.

The article highlights several challenges and future perspectives, such as the increasing complexity of data, the need to expand the repertoire of representations, the lack of standards for visualization, the visualization of ensembles of MD trajectories, technical challenges for efficient graphical representation, the gap between computer graphics and bioinformatics, and the limitations of virtual reality (VR), augmented reality (AR), and mixed reality (MR) tools for MD visualization.

Overall, this article attempts to provide a comprehensive overview of the current state of MD visualization and calls for further research and development to address the emerging challenges posed by the rapid growth of MD simulations in terms of scale, complexity and data volume.

A brief history of visualizing membrane systems in molecular dynamics simulations


Here we explore the remarkable journey to visualize the intricate world of membrane dynamics through molecular simulations. From humble beginnings with simple line representations in the 1980s, the field has seen a remarkable evolution driven by advances in computing power and innovative visualization techniques. The article takes us through the decades, starting with the early days when analyzes focused on internal lipid movements due to limited simulation times. With the expansion of computational resources, a flourishing era of molecular viewers began in the 1990s, enabling more complex visualizations of membrane proteins, pores, and global biophysical changes. With the advent of coarse-grained force fields in the 2000s, the complexity of membrane systems skyrocketed, requiring new visualization methods. Tools emerged to analyze global membrane properties such as curvature, volume and surface area, while others focused on molecular details such as lipid flip-flop rates and lipid-lipid interactions.

As ambitions grew, so did the scale of simulations, creating a need for elegant visualization techniques that balanced visual clarity with biological accuracy. Automation and simplification became a critical factor, with tools such as ProLint and PyLipID identifying and visualizing protein-lipid interactions in large membrane systems. In the face of ever-increasing complexity, the article highlights the importance of advanced computer graphics, virtual reality and augmented reality to shed new light on these crowded environments. It suggests working with computer scientists, designers and other experts to find innovative ways to visualize and abstract these complicated systems. Finally, we point out the need to combine the visualization of simulated membrane models with experimental data to blur the lines between theory and experiment.
Comments

Sorry for the long silence.. moving my whole toolchain!

DecorativeLately, it has been quite silent here on my blog. I have been moving my whole workflow and toolchain to a new paradigm, so I put the production of new content on hold until I started to get a working implementation. This is now slowly coming together, but it is still not quite there yet. For now I will minimally add new information here, and later on transition all the current content to the new system. Here are a few brief snippets of information.
I was really fascinated by discovering the full depth of possibilities with the Emacs text editor. I was in particular inspired by the fantastic materials put online by David Wilson on his System Crafter's website. My Emacs-workflow approach extends also to usage in computational sciences, for instance using notebook-like literate programming approaches (org-mode tangling in Emacs jargon) for my daily research work. The talk (in French only, sorry) on Esthétique et Notebook (Emacs) by Nicolas Rougier is extremely inspiring in this respect.

Such a change in my day-to-day working method has many ramifications on very diverse topics such as managing your dotfiles, taking notes (I am re-balancing from Evernote towards Emacs org-roam now), programming IDEs (doing Unity development within Emacs!), generating my contents (website, blog etc.) and many more. So far, I did a first test of linking my original org file blog entries to my website workflow, where I still use (at least for the present one) RapidWeaver. Within RW, I use mostly Markdown, or some simple plain html. The org format in Emacs can efficiently be changed into either of those languages, Markdown or html. So this org->html->RW chain will do temporarily for now. In the longer run I want to achieve more automation.

Unfortunately, I did not manage to script RapidWeaver (e.g. for generating a new blog post from the Emacs export). I experimented with another tool, at least for the blog part: LazyBlorg. It is both very powerful and customizable and ties in very well with org-mode. For now I am experimenting on my personal blog, going by the name B@amCode#. There I will report much more about my Emacs meanderings, tools and workflows to streamline tasks with my whole new toolchain. So if you are interested in these more technical bits, have a look there! On the present blog here, I will concentrate on scientific research and related topics.
Comments

Protein Alignment in Membranes Gets a Boost: A New Algorithm for Interactive Molecular Simulations

Recently, my colleagues and I published a scientific paper in the journal Algorithms on an algorithm that allows for fast and interactive positioning of proteins within membranes. The original model was strongly inspired by Brasseur's work from the end of the 90s.

Molecular simulations of protein alignment in membranes are crucial for understanding the behavior and function of these biological systems. However, traditional molecular simulation methods such as molecular dynamics simulations in fully hydrated lipid bilayers can be time-consuming and difficult to manipulate in real-time.

To address this challenge, we developed an algorithm suitable for Interactive Molecular Simulations (IMS) that allows for on-the-fly monitoring and manipulation of protein alignment in membranes at various scales. We integrated several tools, including UnityMol, MDDriver, and BioSpring, to create a flexible and user-friendly framework for IMS.

One key component of our IMS framework is the integration of an implicit membrane model based on the Integral Membrane Protein And Lipid Association (IMPALA) approach. This model allows for multiple levels of representation and the ability to tune degrees of freedom for optimal performance. We validated the IMPALA model in both interactive and exhaustive search modes to ensure its accuracy and reliability. This was not an easy task, because reproducibility for the implementation was difficult due to lacking information in the literature. We tried to reconstruct as good as possible the original conditions of the implementation.


This observation points to one of the challenges in reproducing computational methods from the scientific literature: the frequent lack of comprehensive information and access to source code. Without access to all the necessary details and resources, it is often difficult to fully understand and reproduce computational methods. Even when methods are described in detail in the paper, it can be difficult to understand the underlying implementation without access to the source code. As a result, it can be quite difficult to validate and build upon the methods described in the literature, which can limit their impact and usefulness.

In conclusion, our IMS algorithm allows for real-time, interactive positioning of proteins within membranes, providing a powerful interactive tool for studying the behavior and function of these complex biological systems. I am excited to share this work and hope that it will lead to new insights into the role of proteins in membranes and their impact on human health and disease.

This paper is published with reference André Lanrezac, Benoist Laurent, Hubert Santuz, Nicolas Férey, Marc Baaden. Fast and Interactive Positioning of Proteins within Membranes. Algorithms, 2022, 15 (11), pp.415.; the content is openly accessible from this website. Software and data are also available with doi:10.57745/NSHIWZ.
Comments

Taming the Wild West of Data Management: 4 Tips for Organizing Your Dataset List


Managing a list of datasets as a researcher can be a bit of a challenge, especially when it comes to citing them properly. Unlike a bibliography of publications, there are currently very few tools available to help with this task. In these early days of data management, it can be a bit complicated to keep track of all the datasets you have produced, want to use or are interested in.

One approach to organizing your datasets is to collect their doi identifiers from publicly accessible repositories such as OpenAIRE. There is a convenient CSV export functionality, for instance. You can then use a code like the doiclient python tool contributed by Jonathan Barnoud to retrieve the metadata for this doi list. It uses the nice Crosscite citation formatter. From there, you can extract for instance a bibtex bibliography of all your datasets. With such a bibliography you can then use tools such as pybtex to format the metadata into markdown or html for inclusion on your website.

One potential difficulty you may encounter is with figshare, which is a popular platform for sharing datasets. Many datasets on figshare do not have their own doi, only the doi of the publication they refer to. This can make it difficult to properly process and cite these datasets.

It would be great if there were a data management software with a catalog similar to the ones we have for publications, such as Zotero, but more specific to data. By that I mean the ability for instance to dynamically update, in case there is a new version of the dataset, and also not duplicate different versions of a given dataset for instance. Unfortunately, such a tool does not seem to exist yet, but it would certainly be a welcome addition to the data management landscape.

In the meantime, it is important to do your best to properly cite and organize your datasets. If you have any feedback or suggestions on how to improve this process, please don't hesitate to share it. Here is a link to the new datasets page on my website, where you can see the results of my efforts.

In summary, I recommend to

  1. collect and use doi identifiers for your datasets whenever possible. Maybe a few alternative identifiers such as figshare id, as well, in some cases

  2. automate the treatment of your dois with existing tools such as doiclient or crosscite that allow you e.g. to retrieve a bibtex bibliography of your data

  3. use tools such as pybtex to manage the bibtex conversion to any desired format, including html and markdown

  4. keep a lookout for a data reference management tool that would simplify and streamline these tasks

Comments

A new website arises!

I am happy to announce that I have started the new design for my website! I look forward to showing you the fresh look and improved usability that the new design will bring. Stay tuned for more updates as the new design becomes available.

The first thing I am implementing is the blog. I am experimenting with the options to customize a nice experience (so I hope at least). You can leave feedback here (using Disqus) if you have suggestions or comments.
Read More…
Comments